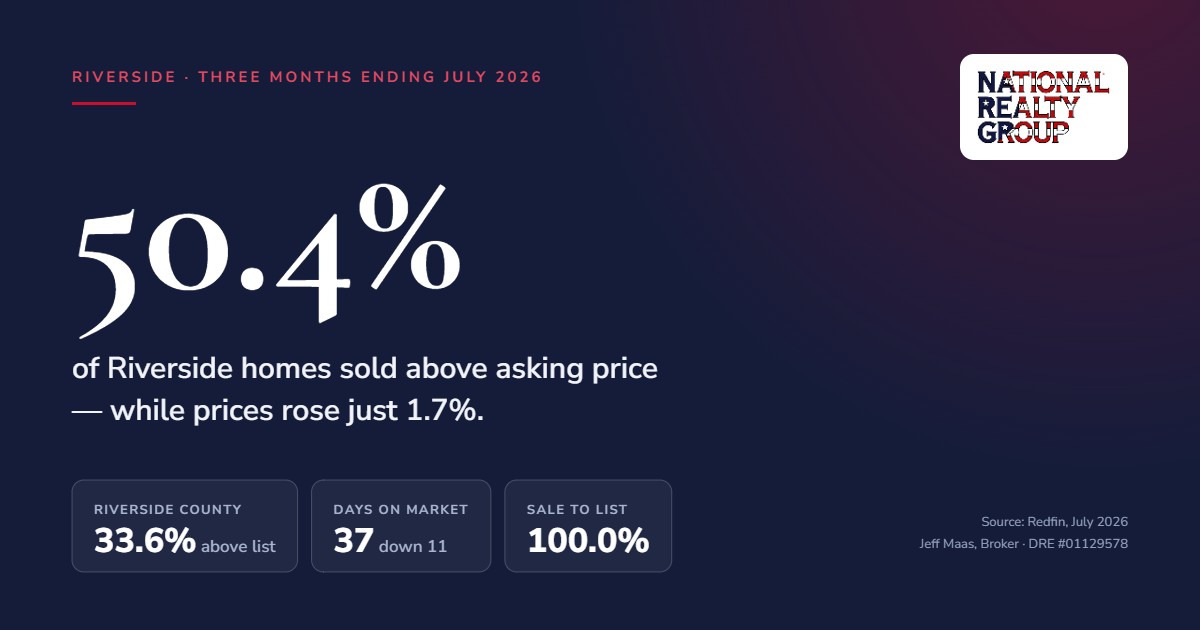
Half of Riverside homes sold above asking between May and July 2026, while prices rose just 1.7%. What that gap means if you are buying or selling.
Are homes in Riverside selling above asking price?
Half of them are.
Between May and July 2026, 50.4% of homes sold in the city of Riverside closed above their asking price. Countywide, it was 33.6%. Those figures come from Redfin's tracking of MLS and public records data through July 2026.
Then there's the part that doesn't fit the story you'd expect. Riverside's median sale price rose just 1.7% over that same stretch. Riverside County rose 3.0%.
More competition. Less price growth. Those two don't usually travel together.
The numbers
City of Riverside, three months ending July 2026
- Median sale price: $655,922, up 1.7% year over year
- Sold above list: 50.4%, up 8.8 percentage points
- Median days on market: 37, down 11 days
- Sale-to-list ratio: 100.0%
- Homes sold: 541, up 2.3%
Riverside County, same period
- Median sale price: $623,167, up 3.0% year over year
- Sold above list: 33.6%, up 3.5 percentage points
- Median days on market: 53, down 8 days
- Sale-to-list ratio: 98.9%
- Homes sold: 2,256, up 2.5%
The 8.8-point jump is the number worth sitting with. Competition inside the city didn't drift upward. It moved two and a half times faster than the county did.
What a 100% sale-to-list ratio actually tells you
The median home in Riverside sold for exactly what it asked.
That is a specific kind of market, and it is not the one people picture when they hear "half of homes sold above asking." A market bidding itself into the sky produces a sale-to-list ratio well over 100%. Riverside produced exactly 100%.
Here is the mechanism. When sellers price accurately, a large share of homes attract more than one offer and settle at or slightly above the number. When sellers price optimistically, the above-list share collapses, because the first job of every offer is to negotiate back down to reality.
A 100.0% ratio paired with a 50.4% above-list share says sellers in Riverside are, on the whole, pricing where the market actually is. The competition is real. The overpaying is not.
If you're buying in Riverside
Two things follow from this, and they point in different directions.
The first: you should plan to compete. At 37 days median and half of homes clearing above ask, a strategy built on finding a motivated seller and negotiating 5% off is a strategy built on a market that isn't showing up in the data. It exists — it always exists — but it is not the median experience right now.
The second is the part that costs me business to say. If you're stretching to win a Riverside offer, the numbers say you don't have to stretch.
The county median is $623,167. Riverside city is $655,922. That's a $32,755 difference. And the typical county listing sits 53 days instead of 37 — sixteen more days to get an inspection back, sixteen more days to think, sixteen fewer reasons to waive something you shouldn't waive.
Moreno Valley, Jurupa Valley, and Perris are all inside a reasonable commute of the same jobs. If your budget is tight enough that Riverside requires waiving a contingency, twenty minutes of driving buys you real negotiating room. I would rather you buy well in Moreno Valley than buy badly in Riverside.
If you're selling in Riverside
The 100.0% sale-to-list ratio is your instruction manual.
Price it where the comps are and the market will meet you, and half the time it will beat you. Price it 8% high because the market is "hot" and you will spend the first three weeks discovering that above-list activity happens to accurately priced homes, not to optimistic ones. Then you'll cut, and the cut becomes the story the next buyer's agent tells about your listing.
The 37-day median is also a median. Half of Riverside listings took longer than 37 days. If yours is on day 30 with light traffic, that isn't a market problem yet — but it is worth a pricing conversation before it becomes one.
What this data does not tell you
Medians hide a great deal. Riverside is not one market. Wood Streets does not behave like Orangecrest, and neither behaves like Mission Grove. A citywide median is a starting point for a conversation, not an answer about your street.
It also doesn't cover the last six weeks. This data runs through July. Anyone telling you with confidence what September looks like is telling you what they hope, not what they know.
And it says nothing about financing costs, which move independently of price and often matter more to a monthly payment than a $30,000 difference in purchase price does.
The short version
Riverside is competitive and getting more so, faster than the county around it. But sellers are pricing honestly and buyers are meeting the ask rather than blowing past it. That is a healthier market than the headline number suggests, and a more disciplined one than a 50.4% above-list share implies on its own.
If you want to know what your specific street is doing rather than what the city median is doing, that's a twenty-minute conversation and I'm happy to have it.
Data: Redfin, Riverside CA and Riverside County CA housing market reports, three months ending July 2026. Figures reflect Redfin calculations from MLS and public records data.
Jeff Maas, Broker · National Realty Group · DRE #01129578
